|
Motion Graphs - Part
I
Objectives
• Be able to plot distance-time graphs to show simply
journeys for objects moving at constant speeds.
• Be able to interpret distance-time graphs in order
to describe and explain the motion of the object.
• Be able to calculate the speed of an object by
finding the gradient of a distance-time graph.
Task 1 - Starter Questions
Answer the starter questions
below, showing full working for all your
calculations:
Q1 A motorcycle travels 820m in 40 seconds. What
speed is the motorcycle travelling?
Q2 A snail travels at a speed of 2
cm/s. How long does it take to travel 5 metres? Give your answer
in seconds, and then convert it to a sensible unit.
Q3 A car takes 6 seconds to
accelerate from 8m/s to 26m/s. What is the car's rate of
acceleration?
Q4 A cheetah can accelerate at 8.5
m/s2. Calculate the time taken for a cheetah to
accelerate:
a) from 10 m/s to 25 m/s.
b) to 25 m/s from rest.
Task 2
We need to be able to draw and interpret two different
types of motion graph. The first is a distance-time graph,
which gives us information about the position of an object. We
will also learn how to obtain information about the object's speed from
this type of graph.
|
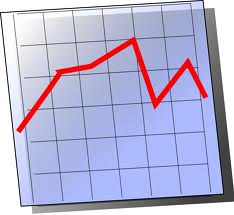
Listen carefully as your teacher explains how distance-time graphs are plotted and how we
can interpret the information on the graph, using
this presentation. |
 |
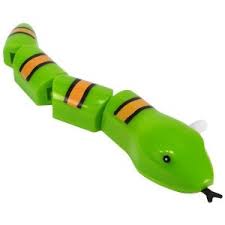
Task 3 - collecting data
We are going to collect some data about the position
of a wind-up toy snake as it moves along the bench, in order to plot our own
distance-time graph.
Draw a table, like the one below, in your exercise
book.
Your teacher will ask some of you to measure the time
taken for the snake to reach the various positions along bench.
Task 4 - graphing motion
Draw a graph of distance (y-axis) against time
(x-axis) for the data you have collected. When you have finished,
draw a line of fit through your points. It should have a straight
section near the beginning, and a curved section near the end.
|
1. Complete the sentences below:
The
toy snake travelled a total distance of _________ cm
The total time taken was _________ seconds.
2. Use the formula you learned to calculate the
average speed of the toy snake. Show full working for your
calculation.
3. Can you explain why it is only an average
speed? Was the snake travelling faster or slower than this
at the beginning of its journey? What about at the end of the
journey?
|
Task 5 - calculating gradients
You should recognise that the snake was travelling
faster at the beginning of the journey than the end. We are going
to try to find out the speed near the beginning and end of the journey.
We will do this using the rule below. Write the
rule in your exercise in large lettering and draw a box around
it.
The gradient of a distance-time graph is the speed.
|
You may have already learned how to calculate
gradients in your mathematics
classes, but your teacher will remind you how to do this!
Start by writing the formula for calculating gradients
somewhere on your graph:
gradient = increase in y
÷ increase in x
|
We are going to find the gradient at two different points on
the graph. You teacher will explain in detail how to find a
gradient on the straight section of the line near the beginning. Follow all the steps
carefully and draw the lines accurately with a pencil and ruler!
Write the gradient you have calculated on your graph.
Remember to include units with it!
Now, you will need to find the gradient further
along the line, where it starts to level off. Follow the same process as last time.
Once again, draw the lines carefully with a pencil and ruler and show
all working for your calculation.
Homework
You will need to practise drawing distance time
graphs. Plot a distance-time graph of the data on
this presentation.
Your teacher will also give you a
copy of the data to stick in your exercise book.
Now, you should see from your graph that the
cyclist has moved at two distinct speeds during his journey.
Draw two straight lines of fit to show this.
1.
Find the gradient and hence the cyclist’s speed
during the first part of the journey.
2.
2.Find
the gradient, and hence the cyclist’s speed during the second
part of the journey.
3.
Calculate the cyclist’s average speed, either by
finding a gradient or otherwise.
|