|
Motion Graphs - Part
II
Objectives
• Be able to plot distance-time graphs to show simple
journeys for objects moving at constant speeds.
• Be able to interpret distance-time graphs in order
to describe and explain the motion of the object.
• Be able to calculate the speed of an object by
finding the gradient of a distance-time graph.
Task 1 - Starter Questions
Remind the person next to you:
• The units of speed.
• The units of acceleration.
• What each term means.
• How to find the speed of an object from a distance time
graph.
Task 2
|
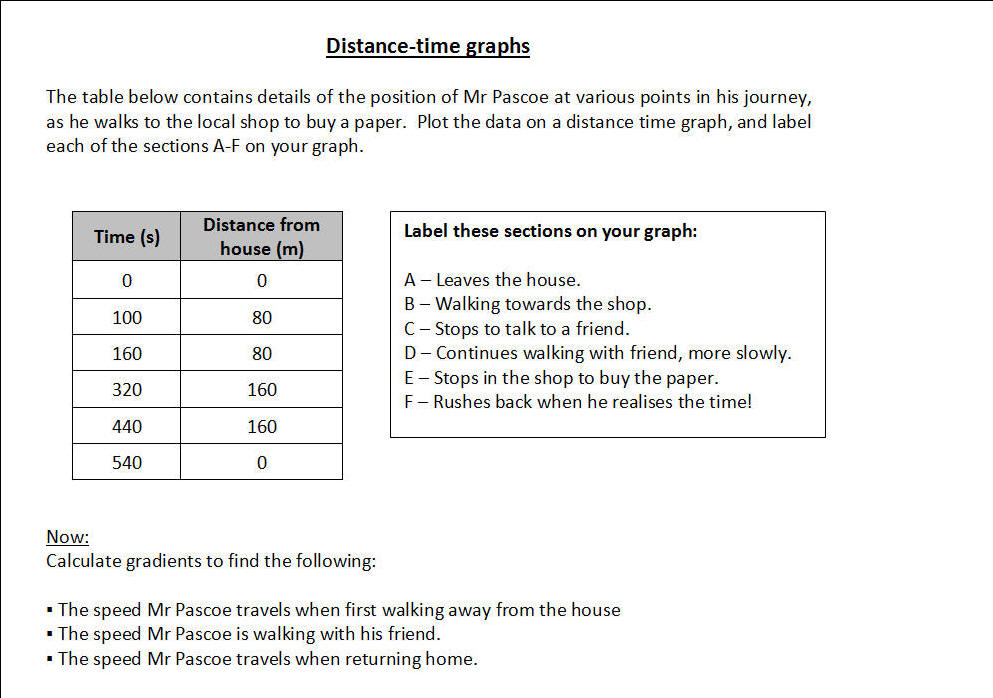
We are going to plot to show the
position of Mr Pascoe as he goes on a short journey, and then
analyse the information on the graph.
Note: this task is available as a word
document
here.
|
 |
|
Time (s) |
Distance from
house (m) |
|
0 |
0 |
|
100 |
80 |
|
160 |
80 |
|
320 |
160 |
|
440 |
160 |
|
540 |
0 |
Task 3 - Qualitative Analysis
When you have finished, label these sections on your
graph:
|
A – Leaves the house.
B – Walking towards the shop.
C – Stops to talk to a friend.
D – Continues walking with friend, more slowly.
E – Stops in the shop to buy the paper.
F – Rushes back when he realises the time!
|
Task 4 - Quantitative Analysis
Calculate gradients to find the following:
• The speed Mr
Pascoe initially walks away from the house.
• The speed Mr
Pascoe walks with his friend.
• The speed Mr
Pascoe travels when returning home.
Remember - the formula for calculating gradients
is:
gradient = increase in y
÷ increase in x
|
Now explain, in full sentences:
• What does the slope of the line tell you about the speed?
• What does the slope of the line tell you about the direction?
• How can you tell when the object is stationary?
|